Does THC Percentage Matter? What Audits and Studies Found
A THC percentage is a concentration, not a dose, and on flower it often runs higher than a lab measures. Here is what six label audits found, how to turn a percentage into milligrams, and why a bigger number did not mean a bigger high for regular users.
Does THC percentage matter? Yes, but less than the label suggests, for three reasons. A percentage is a concentration, not a dose. On flower, the number on the package is often higher than what a lab finds when someone retests it. And when regular users were randomly given a higher-percentage product, the stronger product made no measurable difference to how high they felt.
This page follows the research, not the sales pitch. It covers the audits that took retail cannabis back to a lab, the testing records that show how much the choice of lab moves the result, and two studies that asked whether a stronger product does more. Every number is tied to its source. The milligram figures below are either study conditions or arithmetic on a named item, never a suggested amount. This is general information for adults 21 and over, not medical advice. Planntz sells hemp products, not dispensary flower or concentrates. We cover this because reading a potency number honestly takes the same skill whatever you buy.
Does THC percentage matter? Start with what it measures
A THC percentage is the share of a sample's weight that a lab counted as THC. On flower, 20% THC means that one lab, testing one sample, found THC making up a fifth of its weight on whatever basis it used. Three details change what that number means, and labels rarely spell them out:
- Which THC. Fresh cannabis holds most of its THC as THCA, an acid form that becomes THC when heated. "Total THC" counts both: delta-9 THC plus 0.877 times THCA. A label that says only "THC" may mean either one.
- A percentage of what. Dry weight, the whole item, a gram or a package: the denominator decides the number, and the seller chooses it.
- Which sample. The percentage describes the few grams the lab tested, not necessarily the buds in your package.
Where the 0.877 comes from, and how to add THCA and delta-9 together, is worked through in our side-by-side of CBD and THC. The denominator problem matters most for hemp, where the legal 0.3% limit depends on it, and our guide to hemp-derived THC explains why a percentage is a ratio whose bottom half the seller picks.
One more distinction will help with the audits below. If a label says 20% and a lab measures 15%, the gap is 5 percentage points, but the product holds 25% less THC than claimed. Studies report both kinds of gap, and they sound very different. Where it matters, we say which kind each figure is.
From percentage to milligrams: the arithmetic
To turn a percentage into milligrams, multiply it by the weight in milligrams. A gram is 1,000 mg, so a gram of flower at 20% THC holds 200 mg of THC. Researchers do exactly this. In a Johns Hopkins dosing study published in 2018, the team needed a 25 mg THC condition, and their cannabis tested at 13.4% THC. So they weighed out 186.6 mg of it: 13.4% of 186.6 mg is 25 mg. For the 10 mg condition, they used 74.6 mg of the same batch. That is all a percentage is: a way to get from weight to milligrams.
| Material | Amount | THC percentage | THC present | Source of the numbers |
|---|---|---|---|---|
| Flower | 1 g (1,000 mg) | 20% | 200 mg | Worked example |
| Cannabis used in a dosing study | 186.6 mg | 13.4% | 25 mg | Spindle 2018, the 25 mg study condition |
| Cannabis used in a dosing study | 74.6 mg | 13.4% | 10 mg | Spindle 2018, the 10 mg study condition |
| A typical pre-roll, as the same authors describe it | About 1 g | 18% or more | About 180 mg or more | Spindle 2018 discussion; our arithmetic |
| Concentrate | 1 g (1,000 mg) | 90% | 900 mg | Worked example |
| Concentrate | 0.1 g (100 mg) | 90% | 90 mg | Worked example |
Two cautions. First, "THC present" is what the material contains, not what reaches your bloodstream. Some is lost in smoke that burns off or is breathed out, and the route changes how much acts and how, which is why milligrams taken by mouth behave differently from milligrams inhaled. Second, none of these figures is a suggested amount. The 10 mg and 25 mg conditions were set by researchers for a supervised lab study. The pre-roll row only shows scale: the authors describe a typical pre-roll as about a gram at 18% THC or more, which by our arithmetic is roughly seven times the 25 mg condition that produced strong effects in their study.
Milligrams are also the unit research has settled on. Since 2021, NIDA has asked researchers funded through participating NIH institutes to report THC in a standard unit of 5 mg of delta-9 THC, so studies can be compared; 10 mg counts as two units. NIDA states plainly that the unit does not indicate safety and does not endorse any amount for use.
The gap between the two units is easiest to see on an item that prints both. The certificate for our own full-spectrum tablets (batch 260505) lists total THC as 0.297% of the tablet's weight, 2.73 mg per 0.92 g tablet and 109 mg per package. The percentage sounds like almost nothing, while the milligrams tell you what one tablet holds (our walkthrough of that certificate covers the rest of it).
Is the number on the label true? Six audits, one at a time
Between 2023 and 2026, several research teams compared lab results with the THC printed on retail packages. Their samples came from different places: some were bought by the researchers, some collected by law enforcement and some donated by study participants. They also tested different kinds of item. So we report each audit separately and never add them together.
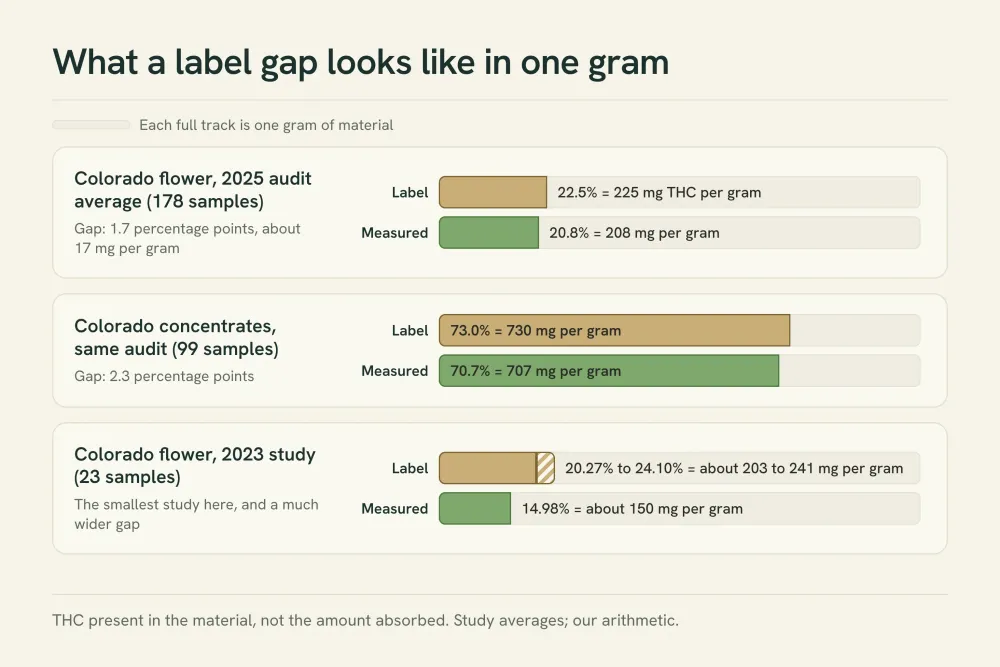
Schwabe 2023, Colorado flower. A 2023 study bought 23 flower samples from 10 Colorado dispensaries and retested each one three times. Measured THC averaged 14.98%, while the labels averaged 20.27% at the low end of their printed values and 24.10% at the high end. Of the 23, 18 measured below the lowest number on the package, and 16 came in more than 15% below it. On average, a sample tested 23.1% below its lowest label value and 35.6% below its highest. Those are relative gaps, averaged sample by sample. Five of the 23 measured at or above the lowest label value. It was a small sample, bought opportunistically in one state, and two authors worked for the testing lab while the data were collected.
Geweda 2024, flower from three states. A University of Mississippi team tested 107 dispensary flower samples that law enforcement had collected in Colorado, Oregon and California. The clearest result does not depend on how you define accuracy: 98 of the 107 measured below the label. By the authors' calculation, 32 of the 107 were within 20% of the label. Of the nine that measured above the label, only one was far enough off for the authors to count it as mislabeled (labeled 12.04%, measured 15.37%). Two packages claimed more than 50% THC and tested at about 27% and 29%. The samples' age was unknown, and the team used gas chromatography, a different lab method from the liquid chromatography used in the other audits here.
Giordano 2025, Colorado flower and concentrates. The biggest audit here with a full paper to read, and the one we would weigh most, tested 178 flower and 99 concentrate items bought from 52 recreational dispensaries in 19 Colorado counties between November 2022 and October 2023, with both the purchasing and the lab analysis blinded. Concentrates matched their labels within Colorado's 15% allowance 96% of the time (95 of 99). Flower matched 56.7% of the time (101 of 178); 30.3% was labeled higher than measured and 12.9% lower. On average, though, the flower gap was modest: 22.5% on the label against 20.8% measured, a mean percent difference of 5.19%. The authors suggest their smaller average gap, compared with the 2023 study, may reflect their larger and more representative sample. Labels were also inconsistent about what they counted: 37.5% said "Total THC", 43.7% said "THC" and 18.8% said both. Two authors worked for MedPharm, a licensed cannabis research company that also manufactures cannabis products in bulk for the Colorado market, and its staff bought and analyzed the samples; the company states it had no stake in any product tested.
Limbacher 2026, Colorado items donated by participants. A 2026 Colorado study tested 74 items its participants brought in: 35 flower, 10 concentrates and 29 edibles. Flower labels had a median of 23.1% THC against 18.1% measured, a median difference of 4.25 percentage points. Concentrates (median 74.3% labeled, 72.6% measured) and edibles (10.0 mg labeled, 9.1 mg measured) came close, and flower was the only category whose measured THC differed significantly from Colorado's 15% allowance. The authors explain that allowance with an example: flower labeled 30% may actually contain 25.5% to 34.5%. It was a convenience sample with only 10 concentrates, so treat it as a check on the audits, not a census.
Doggett 2024, legal oils in Ontario. Oils showed the same pattern in milligrams. Researchers tested 30 oral cannabis oils sold legally in Ontario, picked at random from the provincial store between November 2021 and January 2022. For THC, 12 of the 30 (40%) fell outside Health Canada's 15% allowance for extracts. For CBD, 3 fell outside. Across those THC and CBD misses, the authors report that all but one were labeled higher than measured. They add that no oil held so much extra THC that they would expect a noticeably stronger effect. These are Canadian legal oils labeled in mg per gram, not US flower and not hemp.
Savage 2026, Colorado flower by how it was sold. A follow-up from the same Colorado group, published online in September 2026, sorted 265 flower items by how they were sold and found 51.7% accurate within 15%. Pre-rolls were the most likely to be labeled high (59.3%), and 96.0% of the mislabeled flower that the store had repacked was labeled high. Only the abstract was available when we wrote this. Its purchases overlap in time with the 2025 audit and come from the same group, so the two may share samples, and their numbers should not be combined.
| Study | Where and how sourced | Item type | Samples | What was found | What matched |
|---|---|---|---|---|---|
| Schwabe 2023 | Colorado, bought at 10 dispensaries | Flower | 23 | Mean measured 14.98% against labels averaging 20.27% to 24.10%; 16 of 23 more than 15% below the lowest label | 5 of 23 at or above the lowest label |
| Geweda 2024 | Colorado, Oregon, California; collected by law enforcement | Flower | 107 | 98 of 107 measured below the label | 32 of 107 within 20%, by the authors' calculation |
| Giordano 2025 | Colorado, bought blind at 52 dispensaries | Flower | 178 | 30.3% labeled high, 12.9% labeled low; mean 22.5% labeled vs 20.8% measured | 56.7% within 15% |
| Giordano 2025 | Colorado, bought blind at 52 dispensaries | Concentrates | 99 | 2 labeled high, 2 labeled low; mean 73.0% labeled vs 70.7% measured | 96% within 15% |
| Limbacher 2026 | Colorado, donated by participants | Flower | 35 | Median 23.1% labeled vs 18.1% measured; the only category significantly outside the 15% allowance | No per-sample count printed (medians only) |
| Limbacher 2026 | Colorado, donated by participants | Concentrates; edibles | 10; 29 | Median 74.3% vs 72.6%; 10.0 mg vs 9.1 mg | Both close to their labels |
| Doggett 2024 | Ontario, random picks from the legal store | Oral oils | 30 | 12 of 30 outside 15% for THC (3 for CBD); all but one of those misses labeled high | 18 of 30 within 15% for THC |
| Savage 2026 (abstract only; may overlap the 2025 audit) | Colorado, bought at 59 dispensaries | Flower | 265 | Pre-rolls most often labeled high (59.3%) | 51.7% within 15% |
Read together, the audits say something narrower than "labels lie". On flower, a label is often off, and when it misses it usually misses high. On concentrates, labels mostly matched. How far flower misses depends on the sample: the 2023 and 2024 studies found large average gaps, while in the blinded 2025 audit the average flower gap was 1.7 percentage points. If you have seen claims that THC labels are inflated by a third, that is close to what the smaller studies here found, not the average in the blinded 2025 audit.
Why labels drift upward
Why would a label lean high? Price is part of the answer. An analysis of more than 31 million flower sales in Washington found that flower with more THC sold for more per gram. The authors of the 2023 Colorado audit say the exact source of the gap they found is difficult to determine, but that "a lack of standardized testing protocols, limited regulatory oversight, and financial incentives to market high THC potency likely play a significant role." Beyond price, three mechanisms have data behind them, and a fourth explanation that often gets the blame turns out to explain little.
The lab you pick moves the number. An analysis of Washington State's testing records from June 2014 to May 2017 found systematic differences between labs that held up after the authors controlled for plausible confounds. After a 2020 author correction, on a dataset of 215,285 results, median total THC for the same kind of THC-dominant flower ran from 17.6% at the lowest-reporting lab to 23.1% at the highest. At the 99th percentile, results ranged from 26.9% at the lowest lab to 31.7% at the highest. From this, the authors suggest that flower approaching or above 30% total THC is very rare, and that many flower labels above 30% may be inaccurate. One author was employed by Leafly, then owned by a for-profit firm in the legal cannabis industry, and the data cover one state's legal market in its first three years. Sending samples to whichever lab reports the highest numbers is often called lab shopping.
Results bunch just above 20%. Natural variation in plants and in lab assays should make the count of results thin out smoothly on either side of 20%. A 2021 statistical analysis of about 142,000 Washington and 55,000 Nevada flower results found that it does not. Results just above 20% were about 43% more common than results just below it in Nevada, and 17% more common in Washington. At two Washington labs whose licenses were later suspended for testing irregularities, the jump was 47%; at the state's highest-volume lab it was about 1%. In the author's words, "The 20% THC threshold is economically meaningful, but biologically arbitrary." The paper reads the pattern as pointing to differences between labs rather than precise manipulation by growers, and notes that the method gives statistical evidence suggestive of manipulation but cannot directly demonstrate improper behavior.
A few grams stand in for a whole batch. The 2023 authors note that potency varies between flowers from the top, middle and lower branches of a plant, and that Colorado's sampling guidelines get limited to no enforcement. Colorado asks for five samples totaling 2.5 grams per harvest batch under a pound, as the 2026 study describes. If the best buds end up in that sample, the label describes buds you may not be buying. The 2025 authors suggest flower misses more often than concentrates because plant material is less uniform and more exposed to imperfect sampling, while concentrates are homogenized during production. Handling seems to matter too: in the September 2026 abstract, pre-rolls and store-repacked flower were the most prone to over-labeling.
Age explains little of it. Old flower does lose THC, and some of it turns into CBN as it oxidizes, so the auditors checked for that fingerprint. The 2023 authors found CBN was not present in sizeable quantities. The 2024 authors found only eight of 107 samples with CBN above 1% and concluded that degradation over time cannot explain the gap. For the storage chemistry itself, see what storage studies found about whether weed goes bad.
Does a higher percentage mean a stronger high?
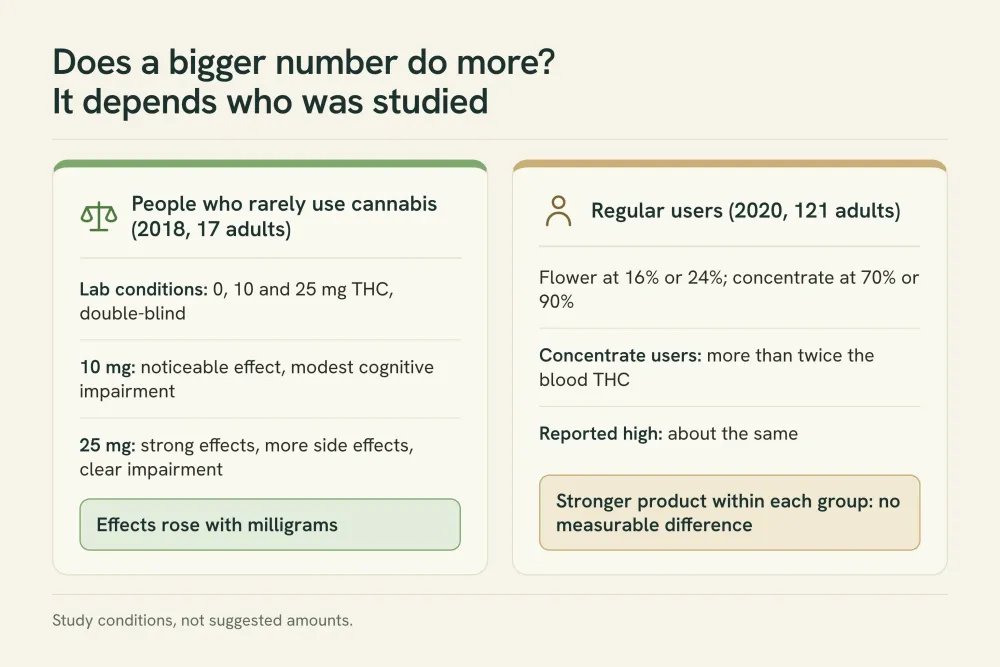
Two studies answer different halves of this question. In the Johns Hopkins study above, 17 healthy adults who had not used cannabis in the previous month (on average, 398 days since they last had) smoked and vaporized cannabis at 0, 10 and 25 mg of THC, in a double-blind, placebo-controlled design. Effects rose in step with the milligrams. At 10 mg there was a noticeable drug effect and modest impairment of cognitive functioning. At 25 mg there were pronounced drug effects, more adverse effects and significant impairment of cognitive and psychomotor ability. Effects were stronger when vaporized: peak blood THC at 25 mg was 10.2 ng/mL smoked against 14.4 ng/mL vaporized.
“Significant, sometimes adverse, drug effects can occur at relatively low THC doses in infrequent cannabis users, and accordingly these data should be considered with regard to regulation of retail cannabis products and education for individuals initiating cannabis use.”
The second study looked at people who already used cannabis regularly. In a 2020 University of Colorado study, 121 regular users bought flower or concentrate from a dispensary. Flower users were randomly assigned a 16% or a 24% product, and concentrate users a 70% or a 90% product. After a five-day period of using it as they liked, they used it their usual way at home and were tested in a mobile lab before use, right after and an hour later. Concentrate users ended up with more than twice the THC in their blood (means of 0.32 against 0.14 micrograms per milliliter of plasma). Yet they reported about the same high as flower users, and both groups showed the same short-lived dip in delayed verbal memory and balance, which recovered within an hour. Within each group, the stronger product made no measurable difference.
Why? Within each form, the authors found no link between a product's potency and users' blood THC, and they suggest regular users may be self-titrating, adjusting their intake as potency rises. That is their interpretation, not something the study measured: the amount of flower or concentrate used did not differ significantly between the stronger and weaker arms. For the similar highs despite very different blood levels, they name tolerance, receptor saturation or individual differences as possibilities and say future research is needed to test them. They also flag the other side of the result: "THC exposure was much higher in concentrate users, prompting concern about long-term clinical and neurobehavioral implications of concentrate use." These were regular users, the form was not randomized (people joined as existing flower or concentrate users), and there was no placebo.
Put the two together. In people new to THC, milligrams tracked the effect closely. In regular users, even very different blood levels produced similar reported highs. In both, the percentage on the package was a step removed from what happened, because it says nothing about how much you use or how used to THC you are. Tolerance is the hidden variable in most "this one hits harder" comparisons, and our guide to taking a tolerance break covers how it builds and fades. Both studies were modest in size, and neither tested edibles or hemp products.
What the percentage cannot tell you
Even an accurate THC number leaves most of the item undescribed. In the 2025 Colorado audit, 84% of items listed no minor cannabinoids at all, although the lab found CBG and its acid form, CBGA, in larger amounts than CBD. Terpenes, the aroma compounds, are the other open question, and many sellers say they matter more than THC. The human evidence on that is mixed, with small trials pointing in different directions. Our look at the entourage effect weighs those studies, and our explainer on cannabinoids versus terpenes covers what each group is. What we can say is narrower: the percentage on the label does not capture any of it.
Many people do not know the number to begin with. In a 2020 survey of 13,689 cannabis consumers in Canada and the US, about two-thirds did not know the THC level of the product they had last used. And an online labeling experiment with 870 Canadians aged 16 to 30 found that few could understand and apply numeric THC labels. That is the gap the arithmetic above is meant to close.
How to read a potency claim in 60 seconds
None of this means you should ignore the number. It means reading it the way a lab would. Use this checklist on any THC claim, whether it is on flower, a concentrate, an oil or an edible, and use our step-by-step guide to reading a certificate of analysis when you have the full document in front of you.
- 1Find out which THC is counted. "Total THC" includes THCA, converted at 0.877. "THC" alone may mean delta-9 only, or may mean total.
- 2Find the basis. Is it a percentage of dry weight, of the whole item, per gram, per serving or per package? Two numbers on different bases cannot be compared.
- 3Convert to milligrams for the amount you are holding: percentage times weight in milligrams. 20% of a 1 g pre-roll is 200 mg of THC present.
- 4Check the test date, the lab's name and the batch number, and make sure the batch on the certificate matches the package.
- 5If the label prints a range, treat the low end as the more realistic figure. In the 2023 Colorado audit, 18 of 23 samples measured below even the lowest printed value.
- 6Be skeptical of flower claims above about 30%. In Washington's lab records, the 99th percentile was 26.9% to 31.7% depending on the lab, and the highest flower result in the three-state audit was 36.55%, against labels as high as 58.20%.
- 7For edibles and oils, read milligrams per serving and per package, not a percentage.
- 8Remember what no label shows: how you respond depends on the milligrams you take, the route and your tolerance, not on the percentage alone.

The risk side of a high number
A higher percentage packs more milligrams into the same weight. The concentrates in the 2020 Colorado study were 70% or 90% THC, and at 90% a tenth of a gram holds 90 mg of THC, several times the 25 mg condition that produced strong effects and more adverse effects in people who rarely use cannabis. Over longer periods, a 2022 systematic review of 20 observational studies found that people who used higher-potency cannabis had a higher risk of psychosis and cannabis use disorder than people using lower-potency cannabis. Those studies cannot show that potency caused it, each defined "high potency" its own way, and results for depression and anxiety were mixed. If someone has taken more than they meant to, our guide to greening out covers what to do and when to call for help.
What is still unknown
- How representative the audits are. Most data come from Colorado, with smaller samples from Oregon, California and Ontario, and lab records from Washington and Nevada.
- How accurate THC labels are on hemp-derived flower. Our September 18, 2026 PubMed search for THC label-accuracy studies returned 11 records, including studies of edibles and CBD oils, but no audit of hemp-derived flower.
- How regular users adjust their intake. Self-titration was suggested by the 2020 authors, not measured.
- Whether label errors change what happens to people. No audit followed buyers to see whether an inflated label changed how much they used.
- How edibles fare at scale. Only one small study here tested edibles (29 samples).
Questions people ask about THC percentage
Not reliably. In a controlled study of people who rarely used cannabis, 25 mg of THC did far more than 10 mg, so milligrams mattered. But when regular users were randomly given 16% or 24% flower, or 70% or 90% concentrate, the stronger product made no measurable difference to the high, and concentrate users with more than twice the blood THC of flower users reported about the same intoxication.
For flower, often not. In a blinded 2025 Colorado audit, 56.7% of flower matched its label within 15%, and most misses were labeled high, though the average gap was small (22.5% labeled, 20.8% measured). Concentrates matched 96% of the time. Smaller studies in Colorado, Oregon and California found bigger flower gaps.
Multiply the percentage by the weight in milligrams. 20% of 1 gram (1,000 mg) is 200 mg of THC in the flower. That is what the material contains, not what your body absorbs, which depends on the route. Researchers work the same way: 186.6 mg of 13.4% cannabis gave one study its 25 mg condition.
Audits point to a few causes. Labs report different numbers for the same kind of flower, results cluster just above the 20% buyers look for, and a small test sample may not match the buds in your package. Age can lower THC too, but auditors mostly did not find enough CBN, its breakdown fingerprint, to blame it.
Sending samples to whichever lab reports the highest numbers. It is hard to prove directly. Washington's records show some labs consistently reporting more THC than others for the same kind of flower, and two labs later suspended for testing irregularities showed a sharp spike in results just above 20%.
A percentage cannot answer that. 20% is 200 mg per gram and 30% is 300 mg per gram, and how either feels depends on how much you use, the route and your tolerance. Washington's lab data suggest flower above about 30% is very rare, so a very high number on flower is worth a second look.
"Total THC" counts THCA as if it had been heated: delta-9 THC plus 0.877 times THCA. A label that says only "THC" may mean either one. In one Colorado audit, labels used "THC" more often than "Total THC", and some printed both.
In the Colorado studies, yes. One audit found 96% of concentrates within 15% of their label against 56.7% of flower, and a second found concentrates close to their labels while flower was not. The first audit's authors point to flower being less uniform and harder to sample.
Writing about hemp, wellness and the small rituals that keep us balanced.